
Using the Dashboard
The Fingerprint Dashboard is the web-based interface for managing your Fingerprint account. It provides a central view of key metrics, configuration settings, and team management.
You can access the dashboard by visiting dashboard.fingerprint.com.
The dashboard is optimized for both administrators and data analysts, making it easy to configure your fingerprinting setup and monitor traffic trends.
Using the Dashboard
- Manage your account and your team: The dashboard enables account owners to invite and assign roles to team members, customize granular access permissions across multiple workspaces, and allows users to manage their personal profile details, time zone, and email notifications.
- Configure resources: Within each workspace, you configure essential resources, including managing various API keys, setting up multiple environments, implementing security features like request filtering and custom subdomains to counter ad blockers, and configuring webhooks to securely receive identification data on your server.
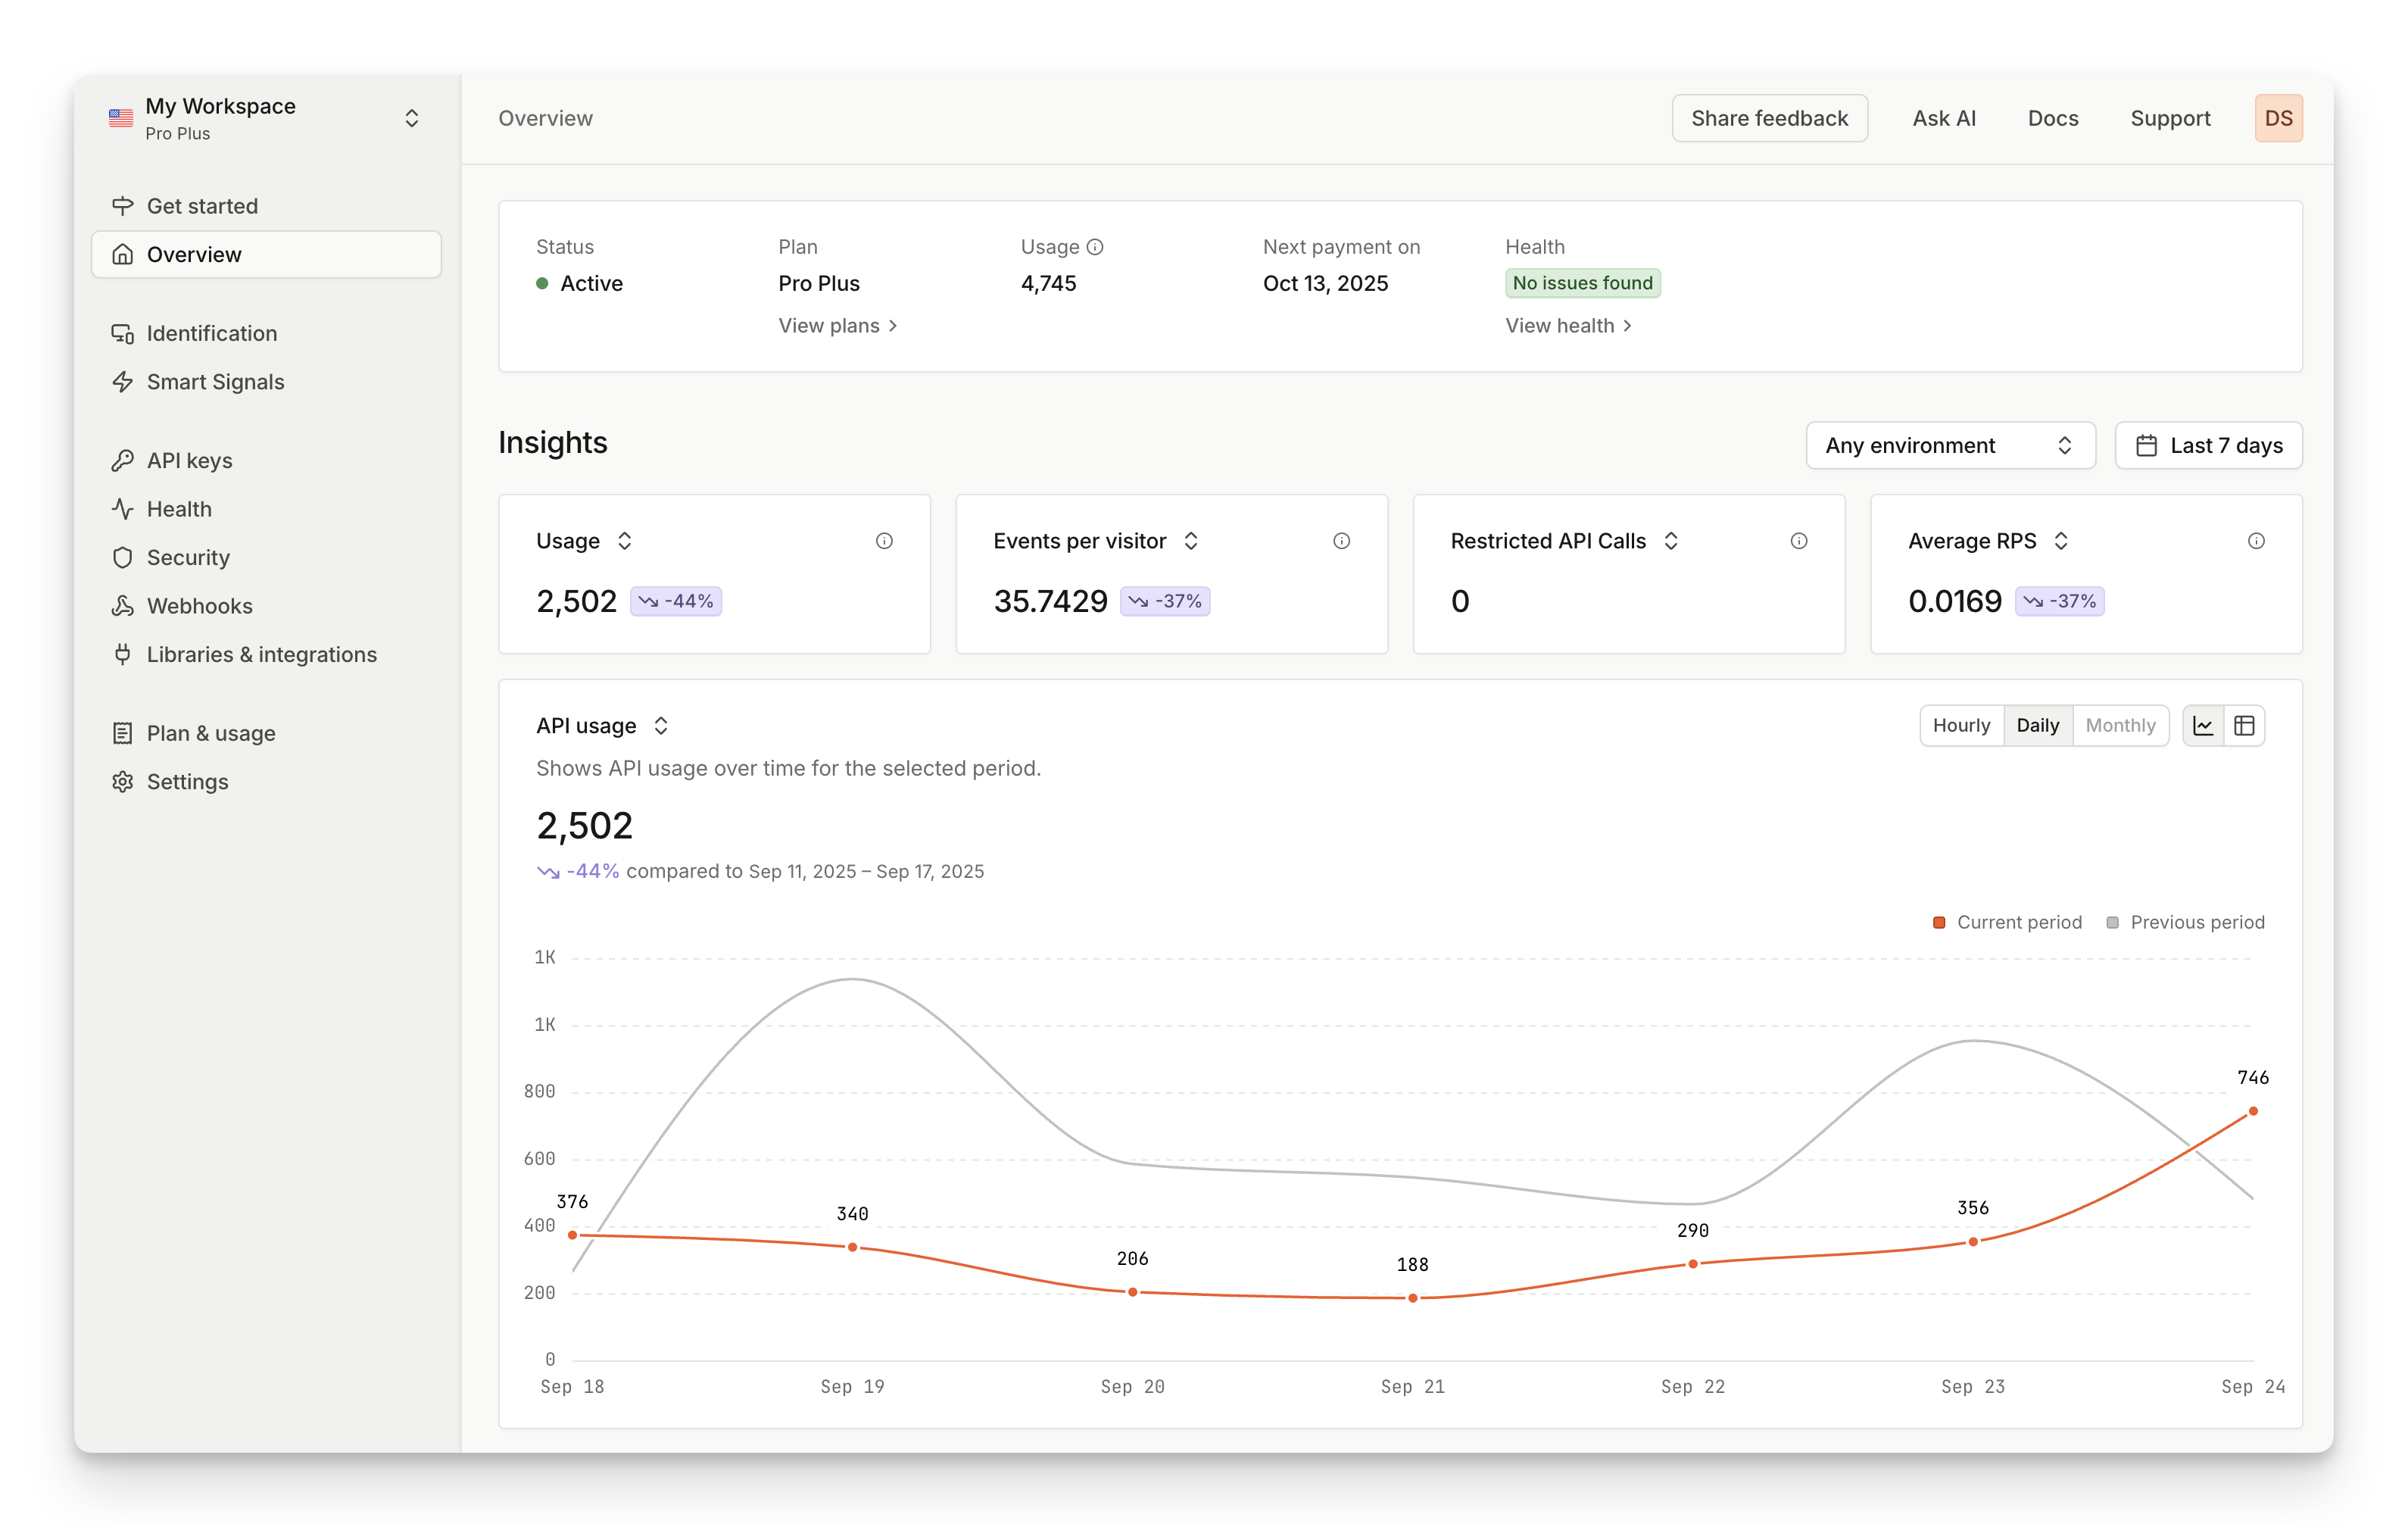
- View analytics: The dashboard provides detailed analytics via an Overview page that shows key metrics like API usage, unique visitors, and top detection lists, a Smart Signals page for monitoring specific suspicious indicators, and an Identification page where users can list, extensively filter, export identification events to CSV, and review thorough event details, including suspect scores and visitor history. Additionally you can monitor health of your integration and SDK upgrades via Health page.
Navigating the Dashboard
You can navigate the Dashboard by using the sidebar. The sidebar contains:
- Workspace selector: switch between different workspaces
- Get started: useful instructions if you’re installing Fingerprint for the first time
- Overview: insights and charts to stay on top of your traffic
- Identification: look up details about specific identification requests
- Smart Signals: discover Smart Signal statistics and adjust Suspect Score configuration
- API keys: create and manage keys for API access, cloud proxy integrations and encryption
- Health: monitor your setup for latency issues or outdated libraries
- Security: configure rules to filter out unwanted requests
- Webhooks: configure webhooks to receive identification events on your server asynchronously
- Libraries & Integrations: manage proxy integrations and libraries
- Plan & usage: manage your plan and view usage for the current billing period
The Settings page consolidates options relevant to your workspace, account, and personal preferences into one place.
- (Workspace) General settings: general workspace settings
- (Workspace) Environments: manage your multi-environment setup
- (Workspace) Subdomains: manage your subdomains
- (Account) Workspaces: manage multiple workspaces
- (Account) Team: manage team members
- (Account) Billing: manage billing information and payment methods
- (User) My profile: manage your user settings
- (User) My notifications: manage your notification preferences
In the top-right section of the page, you will find links for easy access to documentation and support.
Updated 28 days ago