
Monitoring health
The Dashboard allows you to stay on top of integration health, by informing you of required SDK updates, and monitoring throttling, latency, and error rates.
Health overview
The Health page provides you with an overview of your Fingerprint setup.
To check it out, visit Dashboard > Health.
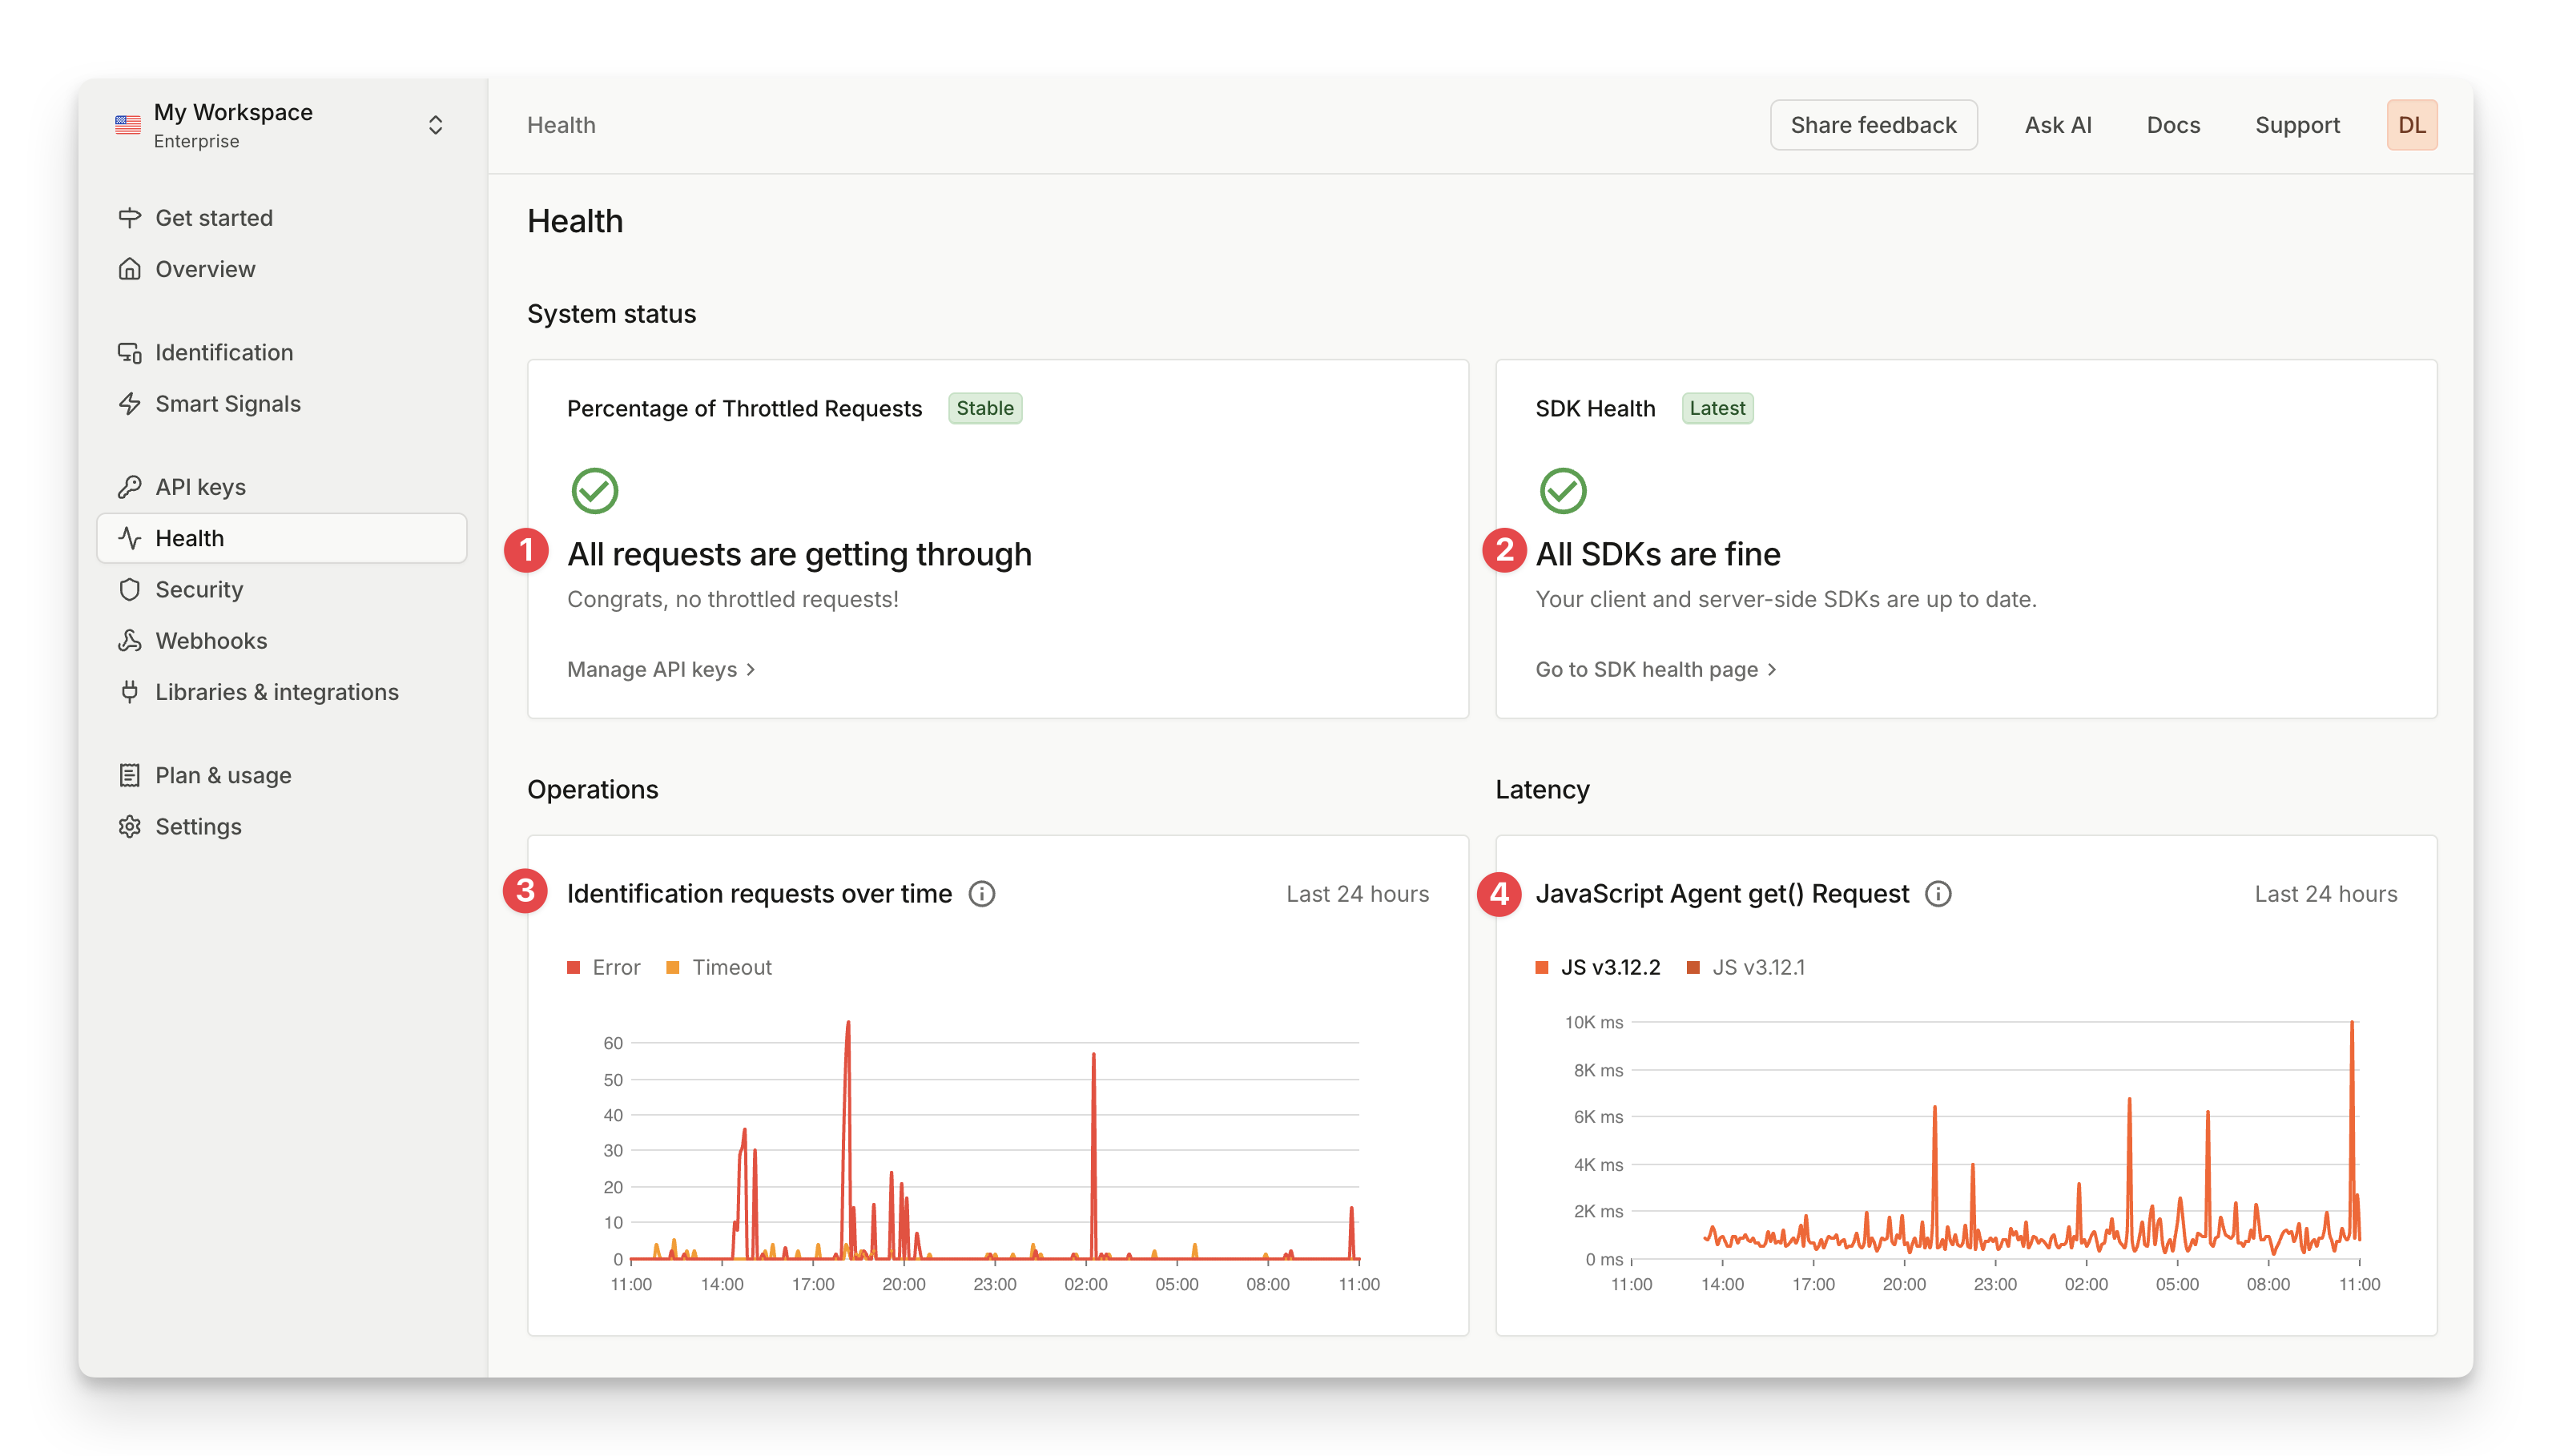
Under the System Status, the throttling widget (1) shows if you've had any API calls going over the configured RPS limit.
On the right side, the SDK health (2) widget shows if you have outdated libraries still making API calls, and will tell you if an upgrade is required or not.
The operations chart (3) shows a number of requests that timed out or resulted in an error in the last 24 hours. This includes both client and server-side errors encountered by the JavaScript agent.
The latency chart (4) shows the average latency for JavaScript agent requests in 5-minute buckets. This is the time it takes a Fingerprint identification request to return data from the server. Only requests from client-side JavaScript SDKs are counted.
SDK health
By visiting the SDK health page, you can see a detailed list of all libraries that were active in the last 30 days. This includes both web and mobile SDKs, as well as Server API SDKs.
To check it out, visit Dashboard > Health > SDK health.
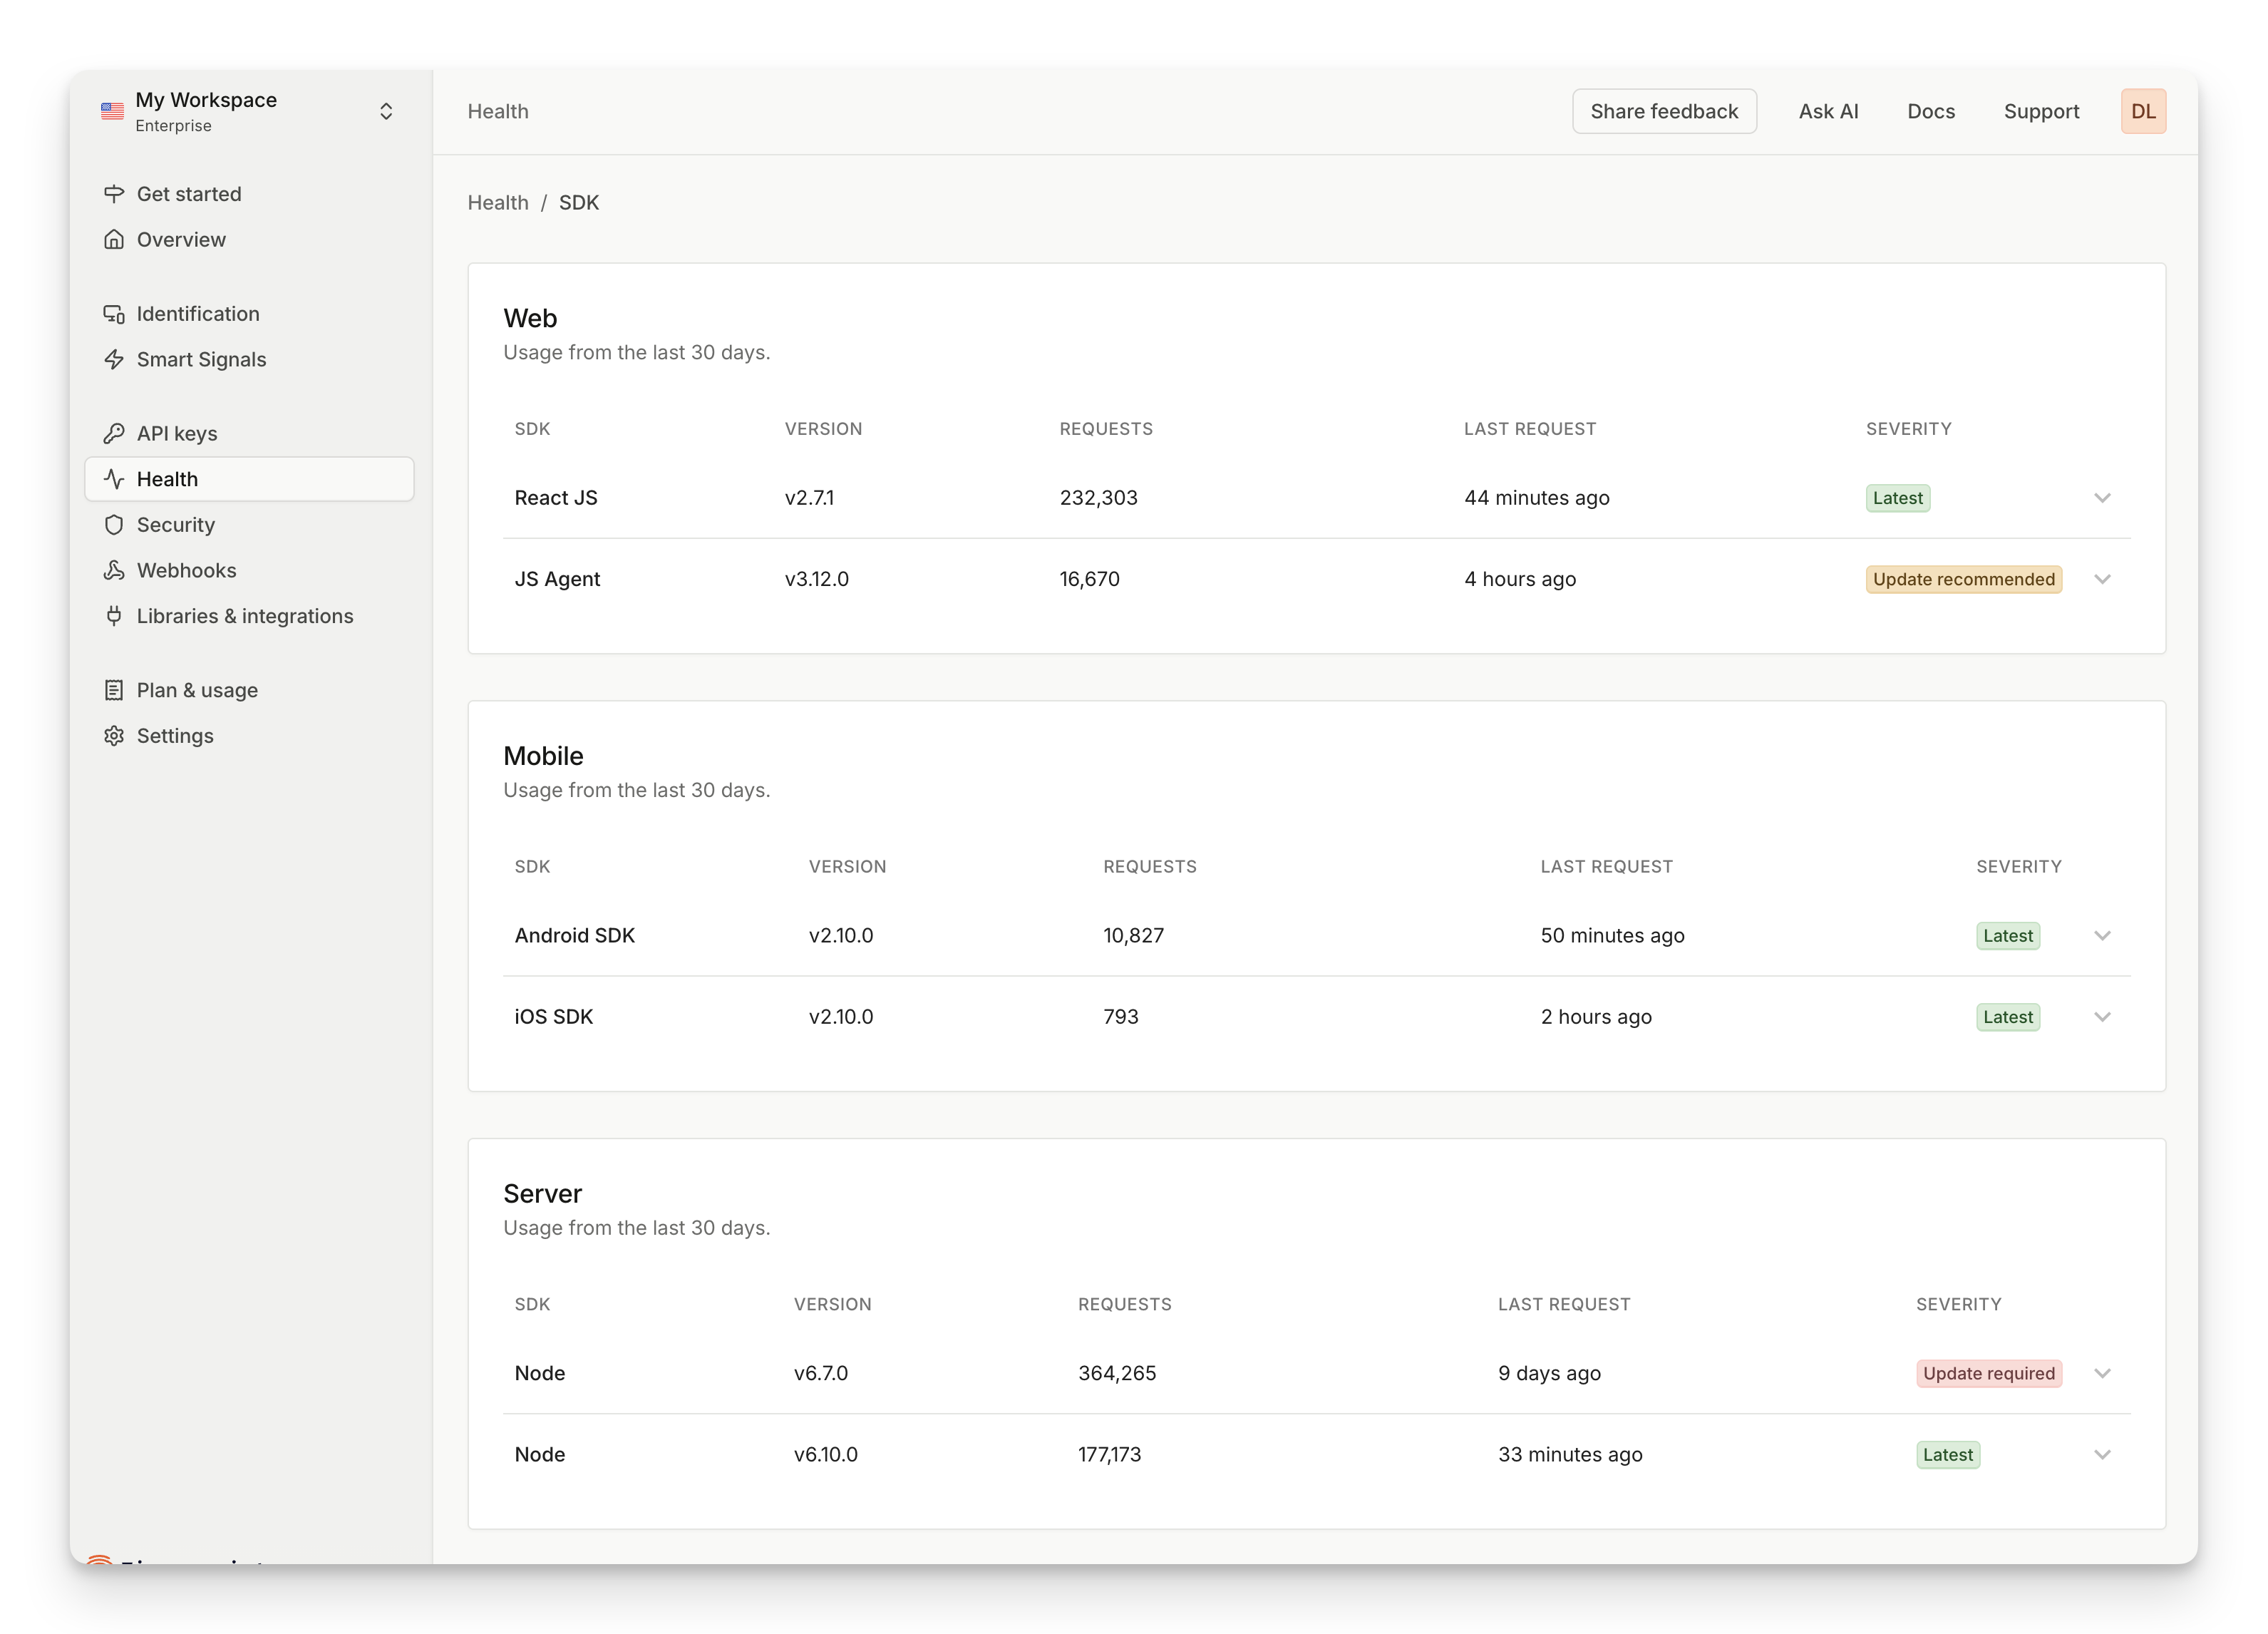
For each SDK, the page shows its version, how many requests were recorded in the last 30 days, when was the last request, and the severity of the SDK being outdated.
By clicking on each SDK row, you can expand it to discover more information.
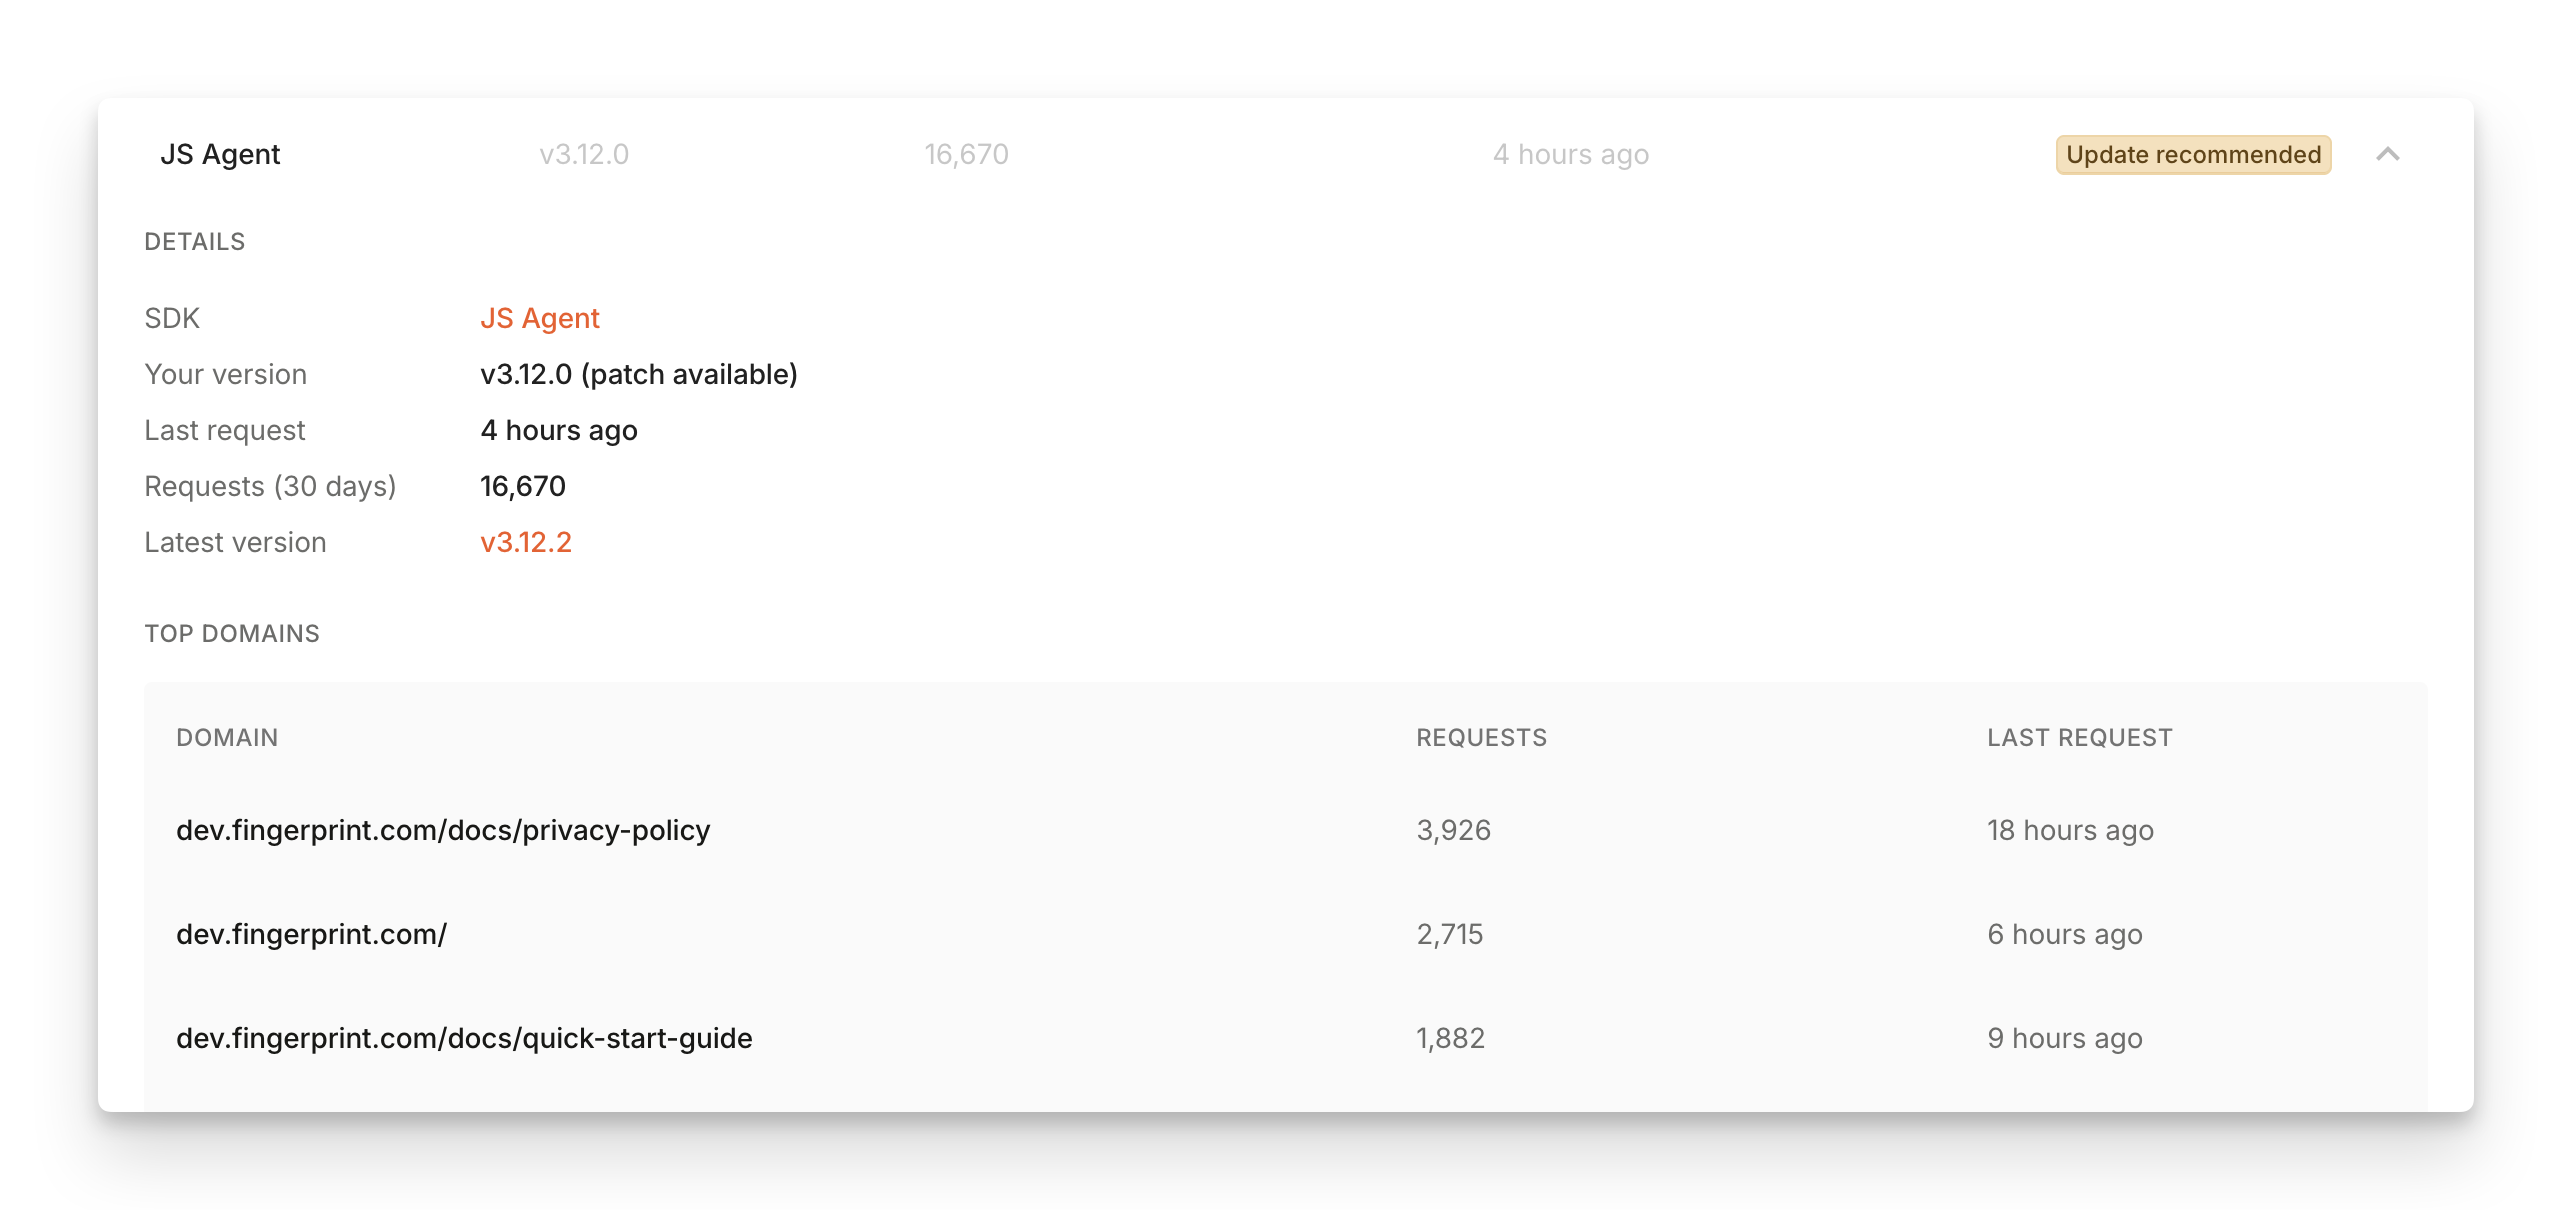
The details panel expands to show the top list of domains and URLs the SDK made the request from. This will help you diagnose and find where the outdated SDKs are still deployed and what locations need to be updated.
Updated about 1 month ago